set SRC=toes.png
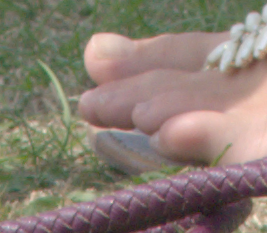
Laplacian pyramids give us frequencies at which data occur.
We sometimes want to know:
The Laplacian pyramid gives us a series of band-pass filtered images that I call "grids". Each grid can be enlarged to the same size as the original. At each point on an enlarged grid, we can measure the magnitude of the slope, and save that as an image. This is a measure of how much detail is present at that particular frequency. If we examine the same pixel in each of these magnitudes, we can find which frequency carries the greatest magnitude.
This page builds on material in:
Related material appears in:
set SRC=toes.png |

|
The initial versions of these scripts processed entire pyramids in a single magick. For a 5000x5000 pixel image with 13 levels, using Q32 HDRI that takes 8 bytes/channel/pixel, the pyramid with enlarged grids took 10 GB of memory before any processing even began. This worked, but took nearly three hours on my 12 GB laptop.
I re-wrote the code to use no more than two input levels at a time. This uses many intermediate files and loops, so it is clumsy and slower than it need be for small images, but does the full-size job in 25 minutes.
Make a Laplacian pyramid (see Multi-scale pyramids). For this worked example, I use default values for block sizes etc.
call %PICTBAT%mkLapPyr %SRC% dtpy_ref.tiff
Get some statistics about the images, using imgsStats.bat:
call %PICTBAT%imgsStats dtpy_ref.tiff dtpy_ref.htm
| # | Size | Min | Mean | Max | SD |
|---|---|---|---|---|---|
| 0 | 267x233 | 0.382135 | 0.500005 | 0.626616 | 0.0108443 |
| 1 | 134x117 | 0.38302 | 0.500016 | 0.676608 | 0.0222262 |
| 2 | 67x58 | 0.312673 | 0.499977 | 0.732677 | 0.0367775 |
| 3 | 33x29 | 0.31484 | 0.499943 | 0.705599 | 0.0446895 |
| 4 | 17x15 | 0.311561 | 0.499705 | 0.762279 | 0.0727658 |
| 5 | 8x7 | 0.35012 | 0.500239 | 0.698405 | 0.0655442 |
| 6 | 4x4 | 0.290115 | 0.488513 | 0.76653 | 0.101497 |
| 7 | 267x233 | 0.5 | 0.5 | 0.5 | 0 |
The last image is the final difference. The other images are the grids. The means are all around 0.5. Minimum and maximum have little significance due to outliers. The standard deviation (SD) measures the amount of variation.
Resize the grids to the size of the input image. This could be done with:
%IMG7%magick dtpy_ref.tiff -resize "%mklpWW%x%mklpHH%^!" dtpy_ref.tiff
However, that assumes the entire enlarged pyramid can fit into memory. Instead, we use a script, imgsResize.bat:
call %PICTBAT%imgsResize dtpy_ref.tiff dtpy_ref.tiff
Calculate the slopes, using slopeMags.bat:
set smAUTO=0

call %PICTBAT%slopeMags dtpy_ref.tiff
Statistics for these slope images:
call %PICTBAT%imgsStats dtpy_ref_sms.tiff dtpy_sms_st.htm
| # | Size | Min | Mean | Max | SD |
|---|---|---|---|---|---|
| 0 | 267x233 | 0.000548794 | 0.0140133 | 0.127536 | 0.0101606 |
| 1 | 267x233 | 0.000794649 | 0.0265415 | 0.161549 | 0.0195273 |
| 2 | 267x233 | 0.000802474 | 0.0356022 | 0.24239 | 0.0255672 |
| 3 | 267x233 | 0.00106345 | 0.0317979 | 0.149596 | 0.0217496 |
| 4 | 267x233 | 0.00119847 | 0.0354339 | 0.1271 | 0.0231965 |
| 5 | 267x233 | 0.000168212 | 0.023578 | 0.0819037 | 0.0138612 |
| 6 | 267x233 | 0.000529831 | 0.0237853 | 0.080798 | 0.0150521 |
| 7 | 267x233 | 0 | 0 | 0 | 0 |
As expected for slopes of ordinary photographs, the values are very low, with means that are barely distinguishable from black.
This is what they look like after -auto-level:
set i2sPROC_EACH=-auto-level
call %PICTBAT%imgs2htm dtpy_ref_sms.tiff dtpy_sms_web.miff dtpy_sms_web.htm
set i2sPROC_EACH=
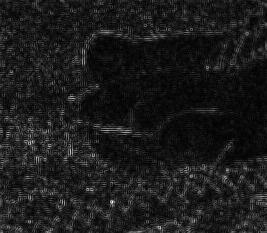
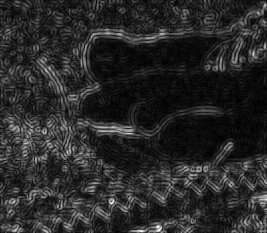
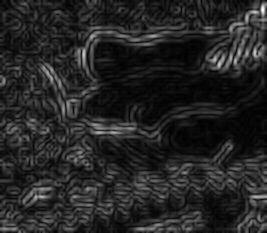
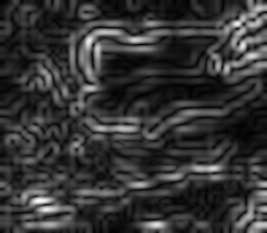
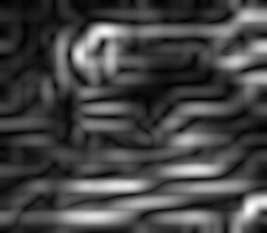
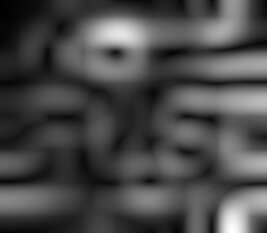


We are not concerned with absolute values of the slopes. Instead, we are concerned with the relative values, which tell us the important frequencies. For each pixel, we find which image contains the greatest slope. The script imgsMax.bat creates a black/white mask for each frequency. It is white where this frequency carries more detail than any other frequency. (Strictly, it is white where this frequency carries at least as much detail, within a small fuzz factor, as any other frequency.)
call %PICTBAT%imgsMax dtpy_ref_sms.tiff dtpy_max.tiff dtpy_sms_max.png
As before, we calculate statistics and make images for the web:
call %PICTBAT%imgsStats dtpy_max.tiff dtpy_max_st.htm
| # | Size | Min | Mean | Max | SD |
|---|---|---|---|---|---|
| 0 | 267x233 | 0 | 0.0109145 | 1 | 0.103901 |
| 1 | 267x233 | 0 | 0.107103 | 1 | 0.309247 |
| 2 | 267x233 | 0 | 0.248284 | 1 | 0.432021 |
| 3 | 267x233 | 0 | 0.177187 | 1 | 0.38183 |
| 4 | 267x233 | 0 | 0.242658 | 1 | 0.428693 |
| 5 | 267x233 | 0 | 0.0933275 | 1 | 0.290893 |
| 6 | 267x233 | 0 | 0.121088 | 1 | 0.326232 |
| 7 | 267x233 | 0 | 0 | 0 | 0 |
In this table, the Mean column tell us for what proportion of the image this frequency has the highest gradient. For example, levels 1 and 2 are the most important frequencies for about 30% each of the image. Level 0 is about half as important. The final difference contains no detail, of course. The two previous images -- the top two levels of the pyramid -- have hardly any detail.
This doesn't mean the data in these levels is unimportant. On the contrary, the top levels contain overall colours that are critical to the image. But they contain very little detail. We can see the masks made by imgsMax.bat:
call %PICTBAT%imgs2htm dtpy_max.tiff dtpy_max_web.miff dtpy_max_web.htm


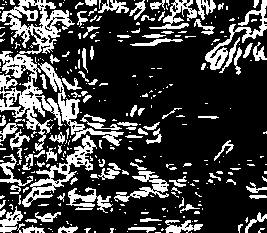
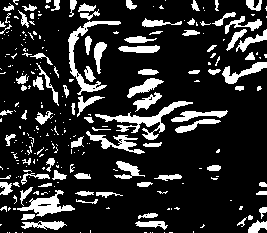
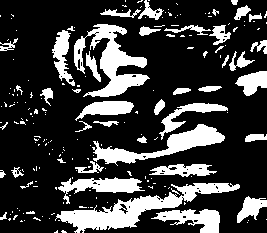
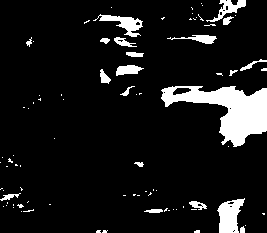
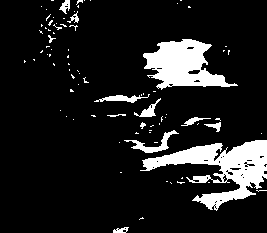

The areas in the grass are white in the first few images, which are band-pass filtered for high frequency. In later images, which represent lower frequencies, the grass becomes black, and the toes and foot become white.
The images also tell us that the grass is quite homogenous: within each individal image, all the grass has pretty much the same degree of lightness. By contrast, the foot and toes are not homegenous; there is high frequency texture, and slightly lower frequency associated with the edges, and then more levels of low-frequency data for the slowly varying lightness.
This set of images is white where the detail at that frequency is equal to the maximum at any frequency. It would be useful if each pixel position was white in exactly one image.
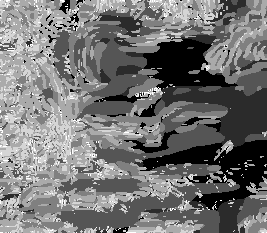
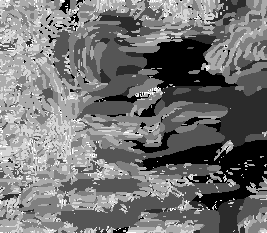
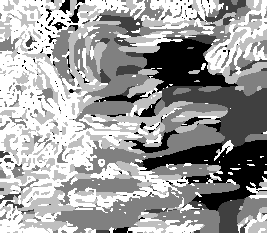
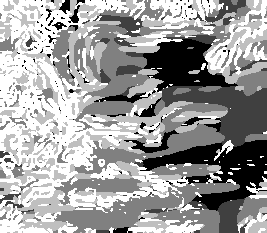
We can present the data in a different way, creating an image that is 0 where the most important level for detail is level 0, 1 where level 1 is the most important, and so on. For visual display, we can auto-level and negate the image, so light areas represent high-frequency data and dark areas represent low-frequency data.
What do we do where two or more levels share equal billing as the most important? We might take the lower level, or the upper level, or the mean of the two, or the mean of all the levels that share equal importance. The simplest way to do this seems to be by having a script, imgsWhich.bat, that writes and executes a script.
call %PICTBAT%imgsWhich ^ dtpy_max.tiff dtpy_.png |
|
The two images are:
 677: (1,1,1,65535) #000100010001FFFF graya(0.0015259%,1)
          6658: (2,2,2,65535) #000200020002FFFF graya(0.0030518%,1)
         15434: (3,3,3,65535) #000300030003FFFF graya(0.00457771%,1)
         11015: (4,4,4,65535) #000400040004FFFF graya(0.00610361%,1)
         15080: (5,5,5,65535) #000500050005FFFF graya(0.00762951%,1)
          5794: (6,6,6,65535) #000600060006FFFF graya(0.00915541%,1)
          7525: (7,7,7,65535) #000700070007FFFF graya(0.0106813%,1)
             3: (8,8,8,65535) #000800080008FFFF graya(0.0122072%,1)
             8: (9,9,9,65535) #000900090009FFFF graya(0.0137331%,1)
             5: (10,10,10,65535) #000A000A000AFFFF graya(0.015259%,1)
             5: (11,11,11,65535) #000B000B000BFFFF graya(0.0167849%,1)
             4: (12,12,12,65535) #000C000C000CFFFF graya(0.0183108%,1)
             3: (13,13,13,65535) #000D000D000DFFFF graya(0.0198367%,1)
If either of these tables show white pixels, then apparently those pixels have a maximum at no frequency. Logically, this shouldn't happen, but can occur due to arithmetical issues. The fuzz factor in imgsWhich.bat should prevent this from happening. When the fuzz factor is too large, we get more overlaps between frequencies.
Based on statistics or other criteria, we might decide to ignore one or more of the highest frequencies. For the script imgsMax.bat, we can start the anaysis at a level other than 0 by setting imSTART_LEVEL.
set imSTART_LEVEL=2
call %PICTBAT%imgsMax dtpy_ref_sms.tiff dtpy_max2.tiff dtpy_sms_max2.png
set imSTART_LEVEL=
As before, we calculate statistics and make images for the web:
call %PICTBAT%imgsStats dtpy_max2.tiff dtpy_max2_st.htm
| # | Size | Min | Mean | Max | SD |
|---|---|---|---|---|---|
| 0 | 267x233 | 0 | 0 | 0 | 0 |
| 1 | 267x233 | 0 | 0 | 0 | 0 |
| 2 | 267x233 | 0 | 0.303548 | 1 | 0.459793 |
| 3 | 267x233 | 0 | 0.20625 | 1 | 0.404615 |
| 4 | 267x233 | 0 | 0.263635 | 1 | 0.440607 |
| 5 | 267x233 | 0 | 0.0993715 | 1 | 0.299163 |
| 6 | 267x233 | 0 | 0.127759 | 1 | 0.333824 |
| 7 | 267x233 | 0 | 0 | 0 | 0 |
As expected, means in the first two images are zero, and the others have increased.
The masks have changed in a similar way: the first two are now black, and the others have increased white pixels. This has changed all the masks that represent grids, but not the mask representing the final difference.
call %PICTBAT%imgs2htm dtpy_max2.tiff dtpy_max2_web.miff dtpy_max2_web.htm


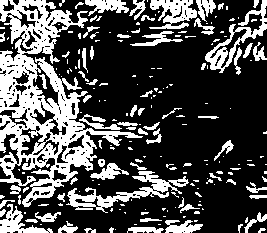
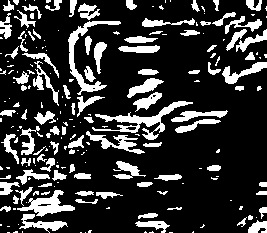
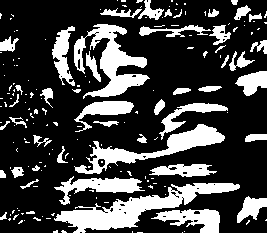
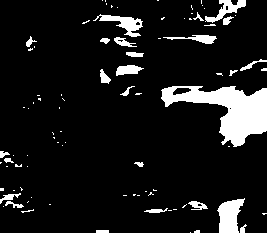
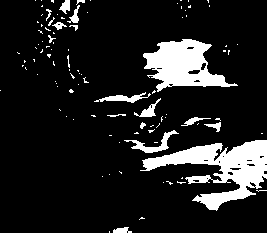

Combining the masks, autolevelling and negating, gives this. The highest frequency recorded is still white, but this is now from level 2.
call %PICTBAT%imgsWhich ^ dtpy_max2.tiff dtpy_2_.png |
|
The two images are:
 18869: (3,3,3,65535) #000300030003FFFF graya(0.00457771%,1)
         12818: (4,4,4,65535) #000400040004FFFF graya(0.00610361%,1)
         16385: (5,5,5,65535) #000500050005FFFF graya(0.00762951%,1)
          6169: (6,6,6,65535) #000600060006FFFF graya(0.00915541%,1)
          7939: (7,7,7,65535) #000700070007FFFF graya(0.0106813%,1)
             3: (8,8,8,65535) #000800080008FFFF graya(0.0122072%,1)
             9: (9,9,9,65535) #000900090009FFFF graya(0.0137331%,1)
             6: (10,10,10,65535) #000A000A000AFFFF graya(0.015259%,1)
             6: (11,11,11,65535) #000B000B000BFFFF graya(0.0167849%,1)
             4: (12,12,12,65535) #000C000C000CFFFF graya(0.0183108%,1)
             3: (13,13,13,65535) #000D000D000DFFFF graya(0.0198367%,1)
How do we measure frequency? To me, the obvious measurement is the inverse of frequency: the wavelength. It measures the size in pixels of objects caught by that band filter. In my scripts, I call this the "block size", which is the amount each pixel is spread when a grid is enlarged. On this worked example, the block size is 1 for level 0, then doubles at each level. So it can be seen that grass has detail at block sizes 1, 2 and 4. There is hardly any grass detail at block size 8 pixels. The edges of the toes feature at block sizes 2, 4 and 8 pixels. The foot area is mostly at 16 pixels. There isn't much data at 32, and virtually none at 64 pixels.
Wavelengths are additive. If detail is present at block size 1, 2 and 4, then 1+2+4=7 so this can represent features about 15 pixels across.
If we have alternating objects with D pixels between their centres, a grid where each pixel expands to 2.D pixels will miss every other object.
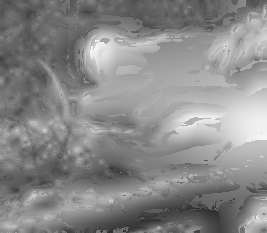
From the masks and a Gaussian pyramid of an image, we can make a version of that image.
set pyLINEAR=1 call %PICTBAT%mkGausPyr ^ %SRC% dtpy_toes_g.tiff set pyLINEAR= call %PICTBAT%imgsMaskGaus ^ dtpy_toes_g.tiff ^ dtpy_max.tiff ^ dtpy_toes_g_img.png |
|
We encapsulate the essentials of the above in a single script, detPyr.bat.
The input is an image.
The important outputs are:
Example from Details,details page.
rem call %PICTBAT%detPyr dt_src.tiff dtpy_ds_@dtpy_ds_max_st.htm
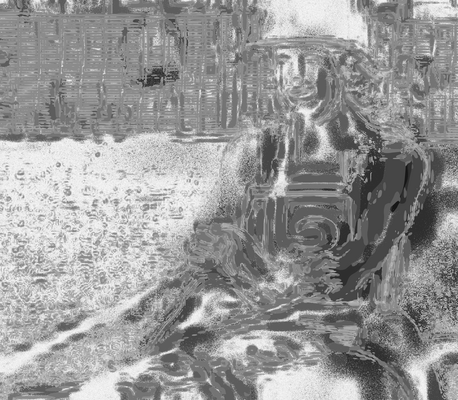
The frequencies have a peak at levels 0-1, and another at level 5.
|
Resized for the web. %IMG7%magick ^ dtpy_ds_iwmax_al.png ^ -resize 600x400 ^ dtpy_ds_iwmax_al_sm.png |
|
|
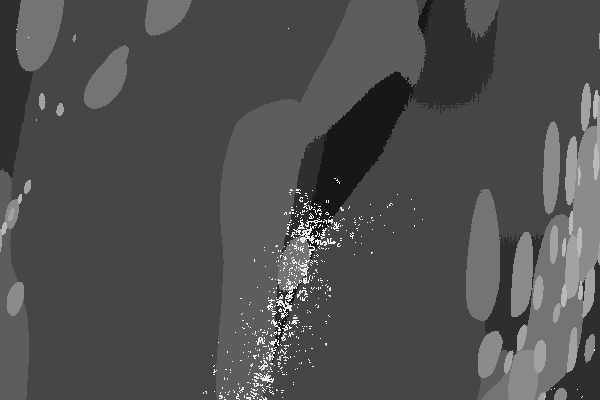
A 1:1 crop of the previous image,
%IMG7%magick ^ dtpy_ds_iwmax_al.png ^ -crop 600x400+4500+2400 +repage ^ ^ dtpy_ds_iwmax_al_cr.png %IMG7%magick ^ dt_src.tiff ^ -crop 600x400+4500+2400 +repage ^ ^ dtpy_ds_src_cr.png |
|
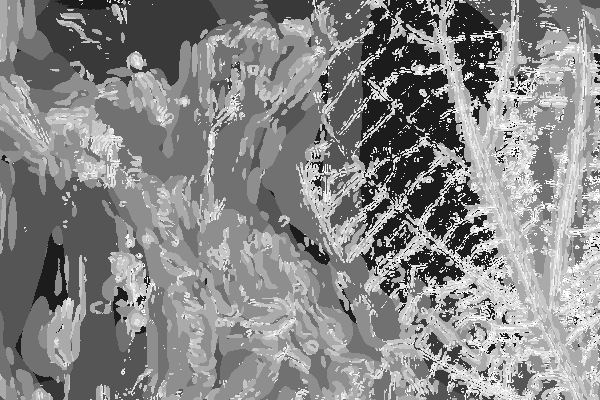
This can be thought of as the low-frequency data (represented by black) painted over the entire image, overlaid with areas of medium-level frequencies (gray), sprinkled with many small areas of high-frequency data.
Another example:
rem call %PICTBAT%detPyr %PICTLIB%20151026\AGA_2680_sRGB.tiff dtpy_lvs_@dtpy_lvs_max_st.htm
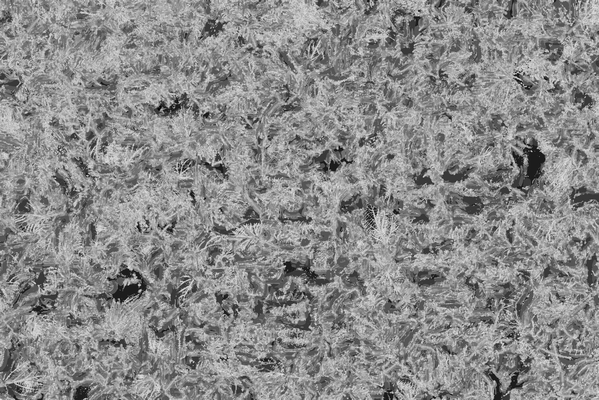
The means peak at level 4 (block size 16), concentrated between levels 2 (block size 4) and 6 (block size 64).
|
Resized for the web. %IMG7%magick ^ dtpy_lvs_iwmax_al.png ^ -resize 600x400 ^ dtpy_lvs_iwmax_al_sm.png |
|
|
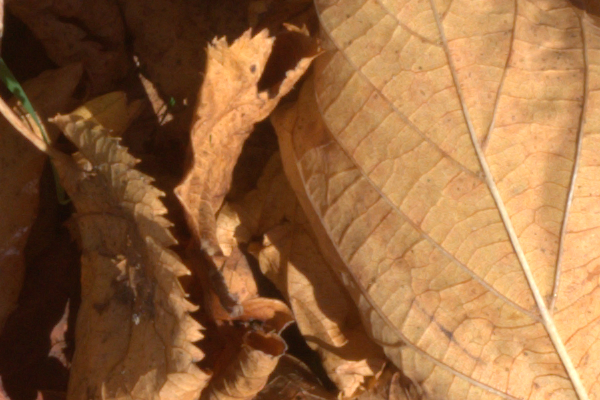
A 1:1 crop of the previous image,
%IMG7%magick ^ dtpy_lvs_iwmax_al.png ^ -crop 600x400+4150+2550 +repage ^ ^ dtpy_lvs_iwmax_al_cr.png %IMG7%magick ^ %PICTLIB%20151026\AGA_2680_sRGB.tiff ^ -crop 600x400+4150+2550 +repage ^ ^ dtpy_lvs_src_cr.png |
|
For convenience, .bat scripts are also available in a single zip file. See Zipped BAT files.
rem Given %1 is multi-image TIFF file,
rem creates TIFF %2 with same number of images, all resized to final image.
@rem
@rem Does not try to read all images into memory at once.
@rem
@rem Updated:
@rem   25-September-2022 for IM v7.
@rem

@if "%2"=="" findstr /B "rem @rem" %~f0 & exit /B 1

@setlocal enabledelayedexpansion


set CNT=
for /F "usebackq" %%L in (`%IMG7%magick identify ^
  -format "CNT=%%n\nisSIZE.%%s=%%wx%%h\n" ^
  %1`) do set %%L

if "%CNT%"=="" exit /B 1

set /A Nm1=%CNT%-1

set isLAST_SIZE=!isSIZE.%Nm1%!

set FILE_LIST=
for /L %%N in (0,1,%Nm1%) do (

  set TMP_TIF=it_tmp_%%N.tiff

  if !isSIZE.%%N!==%isLAST_SIZE% (
    set sRESIZE=
  ) else (
    set sRESIZE=-resize "%isLAST_SIZE%^!"
  )

  %IMG7%magick ^
    %1[%%N] ^
    !sRESIZE! ^
    !TMP_TIF!

  set FILE_LIST=!FILE_LIST! !TMP_TIF!
)

tiffcp %FILE_LIST% %2
del %FILE_LIST%

@endlocal
rem Like slopeMag.bat, but for multi-image files.
@rem
@rem Updated:
@rem   26-July-2022 replace "-evaluate Pow 2 -compose plus -composite -evaluate Pow 0.5" by "-fx hypot(u,v)"
@rem

@if "%1"=="" findstr /B "rem @rem" %~f0 & exit /B 1

@setlocal

@call echoOffSave

call %PICTBAT%setInOut %1 sms

if not "%2"=="" set OUTFILE=%2

set TMP_PREF=sm_%~n1

if "%smAUTO%"=="0" (
  set AUTO=
) else (
  set AUTO=-auto-level -auto-gamma
)

rem This works best with Q32 HDRI.

set isNm1=
for /F "usebackq" %%L in (`%IMG7%magick identify ^
  -format "isNm1=%%[fx:n-1]\n" ^
  %INFILE%`) do set %%L

if "%isNm1%"=="" exit /B 1

set FACT=1
set FILE_LIST=
for /L %%N in (0,1,%isNm1%) do (
  %IM7DEV%magick ^
  %INFILE%[%%N] ^
  -alpha off ^
  -define convolve:scale="50%%^!" -bias 50%% ^
  ^( -clone 0 -morphology Convolve Sobel:0 ^) ^
  ^( -clone 0 -morphology Convolve Sobel:90 ^) ^
  -delete 0 -solarize 50%% -level 50,0%% ^
  +level 0,70.71067811865475%% ^
  -fx "hypot(u,v)" ^
  -separate -evaluate-sequence Max ^
  %AUTO% ^
  -evaluate Multiply !FACT! ^
  -depth 64 ^
  -define quantum:format=floating-point ^
  %TMP_PREF%_%%N.tiff

  for /F "usebackq" %%L in (`%IMG7%magick identify ^
    -format "FACT=%%[fx:!FACT!*1.414]\n" ^
    xc:`) do set %%L

  set FILE_LIST=!FILE_LIST! %TMP_PREF%_%%N.tiff
)

rem %IMG7%magick %FILE_LIST% %OUTFILE%

tiffcp %FILE_LIST% %OUTFILE%
if ERRORLEVEL 1 exit /B 1

del %FILE_LIST%

call echoRestore

endlocal & set smOUTFILE=%OUTFILE%
rem Given multi-image file %1,
rem creates single images named %2 with number suffixed to name,
rem and htm file %3.
@rem
@rem Also uses:
@rem   i2sPROC_EACH processing to apply to each image
@rem
@rem Updated:
@rem   25-September-2022 for IM v7.
@rem


set EXT=%~x2

echo EXT=%EXT%

%IMG7%magick %1 %i2sPROC_EACH% +adjoin +depth %~n2%EXT%

dir %~n2*%EXT% /od

set SUFEXT=
if "%EXT%"==".miff" set SUFEXT=jpg
if "%EXT%"==".tiff" set SUFEXT=jpg


for /F "usebackq" %%L in (`%IMG7%magick identify ^
  -format "isNm1=%%[fx:n-1]\n" ^
  %1`) do set %%L

if not "%3"=="" (

  for /L %%N in (0,1,%isNm1%) do @(
    echo ^<img src="%~n2-%%N%EXT%%SUFEXT%" /^>
  )

)>%~n3.htm

rem if not "%3"=="" call csv2tab %~n3
rem From %1, file of multiple same-sized images,
rem returns %2 with same number of same-size images,
rem white where this image is the maximum of all images; otherwise black.
@rem
@rem Also uses:
@rem
@rem   imSTART_LEVEL
@rem
@rem Also returns variables imMinOfMean etc
@rem
@rem Updated:
@rem   5-September-2022 for IM v7.
@rem

set PREF=%~n2_im_

goto skipInMem

:: If fuzz > 0, we get overlaps.

for /F "usebackq" %%L in (`%IMG7%magick ^
  %1 ^
  ^( -clone 0--1 ^
    -evaluate-sequence Max ^
  ^) ^
  null: ^
  +swap ^
  -compose Difference -layers composite ^
  -fill White ^
  -fuzz 0.0%% ^
  +opaque Black ^
  -fill Black -opaque Black ^
  -negate ^
  +write %2 ^
  -format "mean.%%s=%%[fx:mean]\n" +write info: ^
  -evaluate-sequence Mean ^
  -format "imMinOfMean=%%[fx:minima]\nimMeanOfMean=%%[fx:mean]\nimMaxOfMean=%%[fx:maxima]\n" +write info: ^
  -auto-level ^
  -depth 8 -define quantum:format^=integer ^
  %3`) do set %%L

:: Different strategy to conserve memory:
:: To find max, read just two files at a time.
:: Loop through inputs to find where each matches the max.

:skipInMem

if "%imSTART_LEVEL%"=="" set imSTART_LEVEL=0

set isCNT=
for /F "usebackq" %%L in (`%IMG7%magick identify ^
  -format "isCNT=%%n\n" ^
  %1`) do set %%L

if "%isCNT%"=="" exit /B 1

if %imSTART_LEVEL% GEQ %isCNT% set imSTART_LEVEL=0

echo %~n0: imSTART_LEVEL=%imSTART_LEVEL%

set /A Nm1=%isCNT%-1

:: Special-case if Nm1==0, return white image

if %Nm1%==0 (
  %IMG7%magick ^
    %1 ^
    -fill White -colorize 100 ^
    +write %2 ^
    -fill Black -colorize 100 ^
    %3

  goto :end
)

:: Find the maximum.

set TMP_MAX=%PREF%TmpMax.miff

%IMG7%magick ^
  %1[%imSTART_LEVEL%] ^
  -depth 64 ^
  -define quantum:format=floating-point ^
  %TMP_MAX%

set /A SLp1=%imSTART_LEVEL%+1

for /L %%N in (%SLp1%,1,%Nm1%) do (
  echo %~n0: %%N %TMP_MAX%

  %IMG7%magick ^
    %TMP_MAX% ^
    %1[%%N] ^
    -evaluate-sequence Max ^
    -depth 64 ^
    -define quantum:format=floating-point ^
    %TMP_MAX%
)

set TMP_BLACK=%PREF%tmp_blk.tiff

if not %imSTART_LEVEL%==0 (
  %IMG7%magick ^
    %TMP_MAX% ^
    -fill Black -colorize 100 ^
    %TMP_BLACK%
)


:: Without a fuzz factor, some pixels will not have a maximum at any frequency.

set FILE_LIST=
for /L %%N in (0,1,%Nm1%) do (
  set TMP_LAYER=%PREF%tmp_%%N.tiff

  echo %~n0: %%N !TMP_LAYER!

  if %%N GEQ %imSTART_LEVEL% (
    %IMG7%magick ^
    %TMP_MAX% ^
    %1[%%N] ^
    -compose Difference -composite ^
    -fuzz 0.000001%% ^
    -fill White +opaque Black ^
    -fill Black -opaque Black ^
    -threshold 0 ^
    -negate ^
    -depth 8 ^
    -define quantum:format=integer ^
    !TMP_LAYER!

    set FILE_LIST=!FILE_LIST! !TMP_LAYER!
  ) else (
    set FILE_LIST=!FILE_LIST! %TMP_BLACK%
  )

)

tiffcp %FILE_LIST% %2

del %FILE_LIST%
del %TMP_MAX%

:end
rem Get statistics about an image file %1 (eg a multi-image .tiff file).
rem If %2 not blank, creates that text file and write data as HTM table.
@rem
@rem Does not try to read all images into memory at once.
@rem
@rem Updated:
@rem   5-September-2022 for IM v7.
@rem

set isCNT=
for /F "usebackq" %%L in (`%IMG7%magick identify ^
  -format "isCNT=%%n\n" ^
  %1`) do set %%L

if "%isCNT%"=="" exit /B 1

set /A Nm1=%isCNT%-1

if not "%2"=="" (
  echo #,Size,Min,Mean,Max,SD

  for /L %%N in (0,1,%Nm1%) do @(

    for /F "usebackq" %%L in (`%IMG7%magick identify ^
      -format "isSIZE.%%s=%%wx%%h\nisMIN.%%s=%%[fx:minima]\nisMEAN.%%s=%%[fx:mean]\nisMAX.%%s=%%[fx:maxima]\nisSD.%%s=%%[fx:standard_deviation]\n" ^
      %1`) do @set %%L

    echo %%N,!isSIZE.%%N!,!isMIN.%%N!,!isMEAN.%%N!,!isMAX.%%N!,!isSD.%%N!
  )
)>%~n2.csv

rem set isLAST_SIZE=!isSIZE.%Nm1%!

if not "%2"=="" (
  call csv2tab %~n2
  rem del %~n2.csv
  rem echo ^<p class="center"^>^<tt^>isLAST_SIZE=%isLAST_SIZE%^</tt^>^</p^> >>%~n2.htm
)
rem Given %1 is file of multiple same-size images, each pixel white or black,
rem makes four outputs, all named after %2,
rem with names suffixed iwMin, iwMin_al, iwMax, iwMax_al.
@rem
@rem Updated:
@rem   15 May 2016 use %IML% for @script.
@rem   5-September-2022 for IM v7.
@rem

@if "%1"=="" findstr /B "rem @rem" %~f0 & exit /B 1

@setlocal enabledelayedexpansion


set iwPREF=%~n2
set iwEXT=%~x2

if "%iwPREF%"=="" set iwPREF=iw_
if "%iwEXT%"=="" set iwEXT=.png

set iwNm1=
for /F "usebackq" %%L in (`%IMG7%magick identify ^
  -format "iwNm1=%%[fx:n-1]\n" ^
  %1`) do set %%L

if "%iwNm1%"=="" exit /B 1

echo %~n0: %1

set OUT_MIN=%iwPREF%iwMin%iwEXT%
set OUT_MAX=%iwPREF%iwMax%iwEXT%

set OUT_MIN_AL=%iwPREF%iwMin_al%iwEXT%
set OUT_MAX_AL=%iwPREF%iwMax_al%iwEXT%

goto skipInMem


set SCR_FILE=iw_scr.scr

(
  echo %1
  echo -auto-level

  rem echo -format "bef min=%%[fx:minima*QuantumRange] max=%%[fx:maxima*QuantumRange]\n" +write info:

  echo ( -clone 0-%iwNm1%
  for /L %%N in (0,1,%iwNm1%) do @(
    set /A Np1=%%N+1
    echo ^( -clone %%N -evaluate Min %%N ^)
  )
  echo -delete 0-%iwNm1%
  rem echo -format "F1a min=%%[fx:minima*QuantumRange] max=%%[fx:maxima*QuantumRange]\n" +write info:
  echo -evaluate-sequence Max
  rem echo -format "F1 min=%%[fx:minima*QuantumRange] max=%%[fx:maxima*QuantumRange]\n" +write info:
  echo +write %iwPREF%iwMax%iwEXT%
  echo -auto-level
  echo +write %iwPREF%iwMax_al%iwEXT%
  echo +delete
  echo ^)

  echo ( -clone 0-%iwNm1%
  echo -negate
  for /L %%N in (0,1,%iwNm1%) do @(
    set /A Np1=%%N+1
    echo ^( -clone %%N -evaluate Max %%N ^)
  )
  echo -delete 0-%iwNm1%
  rem echo -format "F2a min=%%[fx:minima*QuantumRange] max=%%[fx:maxima*QuantumRange]\n" +write info:
  echo -evaluate-sequence Min
  rem echo -format "F2 min=%%[fx:minima*QuantumRange] max=%%[fx:maxima*QuantumRange]\n" +write info:
  echo +write %iwPREF%iwMin%iwEXT%
  echo -auto-level
  echo +write %iwPREF%iwMin_al%iwEXT%
  echo +delete
  echo ^)
  echo NULL:
)>%SCR_FILE%


%IML%magick ^
  +depth ^
  -precision 20 ^
  -script %SCR_FILE% ^

:: ------------------------------------------------
:: Different strategy to conserve memory:

:skipInMem

set MAX_LIST=
set MIN_LIST=

for /L %%N in (0,1,%Nm1%) do (
  set TMP_MAX=%iwPREF%iw_tmp_max_%%N.miff
  set TMP_MIN=%iwPREF%iw_tmp_min_%%N.miff

  set /A Np1=%%N+1

  echo %~n0: %%N !TMP_MAX! !TMP_MIN! !Np1!

  %IMG7%magick ^
    %1[%%N] ^
    +depth ^
    ^( +clone ^
       -evaluate Min !Np1! ^
       +write !TMP_MAX! ^
       +delete ^
    ^) ^
    -negate ^
    -evaluate Max !Np1! ^
    +depth ^
    !TMP_MIN!

  %IMG7%magick identify -precision 20 ^
    -format "%%f %%[fx:minima*QuantumRange] %%[fx:maxima*QuantumRange]\n" !TMP_MAX!

  %IMG7%magick identify -precision 20 ^
    -format "%%f %%[fx:minima*QuantumRange] %%[fx:maxima*QuantumRange]\n" !TMP_MIN!

  set MAX_LIST=!MAX_LIST! !TMP_MAX!
  set MIN_LIST=!MIN_LIST! !TMP_MIN!
)

%IMG7%magick %MAX_LIST% -compose Add -layers flatten -format %%c histogram:info:%iwPREF%x1.lis
%IMG7%magick %MIN_LIST% -compose Add -layers flatten -format %%c histogram:info:%iwPREF%x2.lis

%IMG7%magick %iwPREF%iw_tmp_max_0.miff +depth %OUT_MAX%
%IMG7%magick %iwPREF%iw_tmp_min_0.miff +depth %OUT_MIN%

del %iwPREF%iw_tmp_max_0.miff
del %iwPREF%iw_tmp_min_0.miff

for /L %%N in (1,1,%Nm1%) do (
  set TMP_MAX=%iwPREF%iw_tmp_max_%%N.miff
  set TMP_MIN=%iwPREF%iw_tmp_min_%%N.miff

  echo %~n0: %%N !TMP_MAX! !TMP_MIN!

  %IMG7%magick identify -precision 20 ^
    -format "%%f %%[fx:minima*QuantumRange] %%[fx:maxima*QuantumRange]\n" !TMP_MAX!
  %IMG7%magick identify -precision 20 ^
    -format "%%f %%[fx:minima*QuantumRange] %%[fx:maxima*QuantumRange]\n" !TMP_MIN!

  %IMG7%magick  ^
    %OUT_MAX% ^
    !TMP_MAX! ^
    -evaluate-sequence Max ^
    +depth ^
    %OUT_MAX%

  %IMG7%magick  ^
    %OUT_MIN% ^
    !TMP_MIN! ^
    -evaluate-sequence Min ^
    +depth ^
    %OUT_MIN%

  %IMG7%magick identify -precision 20 ^
    -format "%%f %%[fx:minima*QuantumRange] %%[fx:maxima*QuantumRange]\n" !OUT_MAX!
  %IMG7%magick identify -precision 20 ^
    -format "%%f %%[fx:minima*QuantumRange] %%[fx:maxima*QuantumRange]\n" !OUT_MIN!

  del !TMP_MAX! !TMP_MIN!
)

%IMG7%magick identify ^
  -precision 20 ^
  -format "%%f %%[fx:minima*QuantumRange] %%[fx:maxima*QuantumRange]\n" ^
  %OUT_MAX%

%IMG7%magick identify ^
  -precision 20 ^
  -format "%%f %%[fx:minima*QuantumRange] %%[fx:maxima*QuantumRange]\n" ^
  %OUT_MIN%

%IMG7%magick %OUT_MAX% -auto-level -negate +depth %OUT_MAX_AL%
%IMG7%magick %OUT_MIN% -auto-level -negate +depth %OUT_MIN_AL%


@endlocal
rem %1 is an image
rem %2 is prefix for output and working files.
rem %3 is string of up to four numbers, parameters to mkLapPyr.
@rem
@rem Updated:
@rem   5-September-2022 for IM v7.
@rem

@if "%1"=="" findstr /B "rem @rem" %~f0 & exit /B 1

@setlocal enabledelayedexpansion

@call echoOffSave

call %PICTBAT%setInOut %1 dtpy


set PREF=%2
if "%PREF%"=="." set PREF=
if "%PREF%"=="" set PREF=dtpy_%INNAME%_

set MK_PARM=%~3
if "%MK_PARM%"=="." set MK_PARM=
if "%MK_PARM%"=="" set MK_PARM=. . . .

set pyPREFIX=%PREF%

set PYR_FILE=%PREF%pyr.tiff

echo %~n0: Create pyramid...
call %PICTBAT%mkLapPyr %INFILE% %PYR_FILE% %MK_PARM%
if ERRORLEVEL 1 exit /B 1

rem echo %~n0: mklpWW=%mklpWW% mklpHH=%mklpHH%

echo %~n0: Resize pyramid...
%IMG7%magick %PYR_FILE% -resize "%mklpWW%x%mklpHH%^!" %PYR_FILE%
if ERRORLEVEL 1 exit /B 1

rem %IMG7%magick identify %PYR_FILE%

rem Following destroys the pyramid. Better to create stage versions?

echo %~n0: slopeMags...
set smAUTO=0
call %PICTBAT%slopeMags %PYR_FILE% %PYR_FILE%
if ERRORLEVEL 1 exit /B 1
set smAUTO=

echo %~n0: imgsMax...
call %PICTBAT%imgsMax %PYR_FILE% %PYR_FILE% NULL:
if ERRORLEVEL 1 exit /B 1

echo %~n0: imgsStats...
call %PICTBAT%imgsStats %PYR_FILE% %PREF%max_st.htm
if ERRORLEVEL 1 exit /B 1

rem echo %~n0: imMinOfMean=%imMinOfMean% imMeanOfMean=%imMeanOfMean% imMaxOfMean=%imMaxOfMean%

echo %~n0: imgsWhich...
call %PICTBAT%imgsWhich %PYR_FILE% %PREF%.png
if ERRORLEVEL 1 exit /B 1

call echoRestore

@endlocal & set dtpyOUTFILE=%PYR_FILE%& set dtpyNUM_OCTAVES=%NUM_OCTAVES%
All images on this page were created by the commands shown, using:
%IMG7%magick -version
Version: ImageMagick 7.1.0-49 Q16-HDRI x64 7a3f3f1:20220924 https://imagemagick.org
Copyright: (C) 1999 ImageMagick Studio LLC
License: https://imagemagick.org/script/license.php
Features: Cipher DPC HDRI OpenCL
Delegates (built-in): bzlib cairo freetype gslib heic jng jp2 jpeg jxl lcms lqr lzma openexr pangocairo png ps raqm raw rsvg tiff webp xml zip zlib
Compiler: Visual Studio 2022 (193331630)
Source file for this web page is detpyr.h1. To re-create this web page, execute "procH1 detpyr".
This page, including the images, is my copyright. Anyone is permitted to use or adapt any of the code, scripts or images for any purpose, including commercial use.
Anyone is permitted to re-publish this page, but only for non-commercial use.
Anyone is permitted to link to this page, including for commercial use.
Page version v1.0 31-Oct-2015.
Page created 04-Oct-2022 13:00:07.
Copyright © 2022 Alan Gibson.