snibgo's ImageMagick pages
Histogram peaks
When histogram data is stored as images, we can manipulate it with image-processing techniques.
Histogram data can be represented as an image with Nx1 pixels. Each pixel represents one input value, or is a bucket representing a range of input values. The value of a pixel at x-coordinate X represents the number of input pixels that have a value of X, or that fall into the bucket of the range of X.
With HDRI we can represent the actual count of pixels. However, we often normalise so the fullest bucket contains a value of 100%.
I don't bother showing images of histograms, even scaling to a reasonable height. I do show graphs of the histograms, using the script graphLineCol.bat.
The script
histoPeaks.bat takes an image and makes a histogram. It then finds the peaks and troughs, writing these to CSV (comma-separated values) text files.
The script uses process modules. See my page
Process modules, which gives source code and instructions on building them into IM.
For the CSV processing, the script calls utility programs such as cPrefix, cSelect, cNextRow, cHead, cSort and cExtend. I do not provide the source or binaries of these.
An ImageMagick bug in version 6.9.1-6 causes "histogram:" images to be of MIFF format, even though they are named ".PNG". See bug report
Histogram images. So I might use an older version of IM for that task:
set IMH=%IMG691%
set IMH=%IM%
The script may find no peaks, one peak, or many.
For colour images, a peak in any of the R,G,B channels qualifies that bucket as a peak.
There are many possible definitions of a peak, each one suitable for a purpose. My interest is mostly in the area between each adjacent pair of troughs, rather than the peaks themselves. Then I can apply different processing to each tonal region.
For this page, a histogram peak is defined in reference to a sliding window, defined as a proportion of the number of buckets. By default this is 0.1, but can be changed, eg set hpkWIN_PROP=0.25.
A peak is a bucket that has:
- the maximum number of entries of all the buckets in the window;
- at least as many entries as the mean number of entries in the window, plus 2;
- at least as many entries as the mean number of entries in the window, multiplied by 1.1;
Before applying the above rules, we might pretend that the first and last buckets are empty.
Comparing with the mean prevents a peak from being found within a flat but noisy histogram.
For processing convenience, we create a copy of the histogram that is the maximum of the three conditions, and subtract one. Then we subtract this from the histogram. Black pixels are not peaks; pixels with values above zero are peaks.
In HDRI, subtraction can give negative results. "-clamp" raises these to zero.
If we are looking for troughs, we may want to apply the rule:
- Pretend the first and last buckets are peaks. Then the intervals beween all the peaks, taken together, cover the entire image. (set hpkENSURE_ENDS=1)
After all the above, another rule may then be applied:
- A peak that contains less than (say) 10% of the entries in the largest bucket is called a "small peak", and is generally disregarded. (set hpkPK_THRESHPC=10)
(After clamp, auto-level then threshold 10%?)
If two buckets happen to have the same counts and are within window_width of each other, they may both be peaks. So the next rule is:
- No two peaks may be within window_width of each other.
We apply the window_width rule by finding the smallest gap between peaks. If it is less than or equal to window_width we remove the smallest one (or right-most if they are equal) and repeat the process.
If the window_width is 0.1, there will be at most ten peaks. For window_width=0.25, there will be at most four peaks, spaced by at least 25% of the histogram width. We might want to further limit the number of peaks.
- Limit the number of peaks, by eliminating the smallest. (eg set hpkLIMIT_NUM_PKS=4)
A trough (also known as valley) is defined as the emptiest bucket between two peaks. When two buckets are equally empty, the one nearest the center of the peaks is the trough.
To find this, we crop the histogram between each pair of peaks. This is negated and auto-levelled, so the emptiest bucket(s) are white. We could easily pull out all of the whites, but we want the one nearest the center. So we chop the image in half, rotate the left side 90° anti-clockwise and the right side 90° clockwise, and append these side-by-side. "-process onewhite" finds the white pixel that is nearest the top, which is the one nearest the centre of the peaks.
With this definition, a histogram with a single peak has no troughs. A histogram with two peaks has one trough. If it has (n) peaks, there are (n-1) troughs. However, if we have pretended that the first and last buckets are peaks, there will usually be at least one trough, and usually more than one.
Processing time is roughly proportional to the number of buckets, squared.
For this web page, I limit the number of buckets to 1000. This means the graphs can be displayed without being shrunk horizontally. In practise, 10000 (ten thousand) is usually good.
The default limit for 16 bit/channel images is 65536 buckets. For the default window size of 10%, the -statistic process takes a couple of minutes, which I dislike. In addition, few images have 65536 distinct values in each channel; the histogram usually resembles a comb, at least for some ranges. This can be overcome by blurring the histogram (eg set hpkHIST_BLR=-blur 0x2).
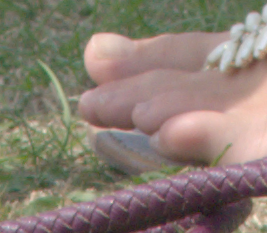
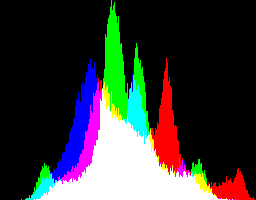
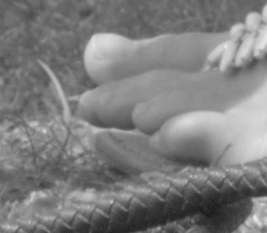
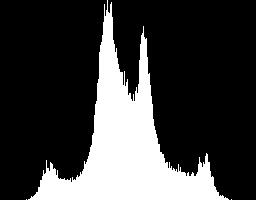
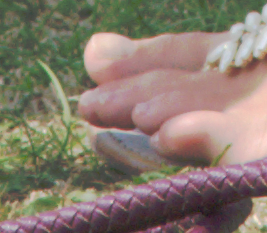
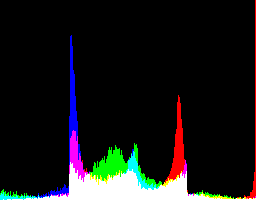
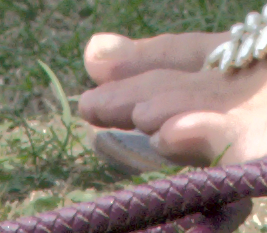
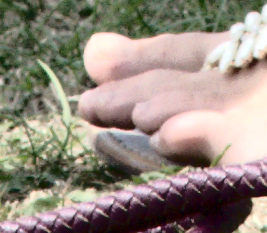
The histogram of the gray version has four clear peaks. The histogram of the colour verson is harder to read; the green channel has four peaks; the red and blue channels each have three.
set hpkOUT_PREFIX=hpk_gr
set hpkCAPNUMBUCKETS=1000
set hpkENSURE_ENDS=
set hpkDEBUG=1

call %PICTBAT%histoPeaks %SRC_GR%

set hpkDEBUG=
set hpkENSURE_ENDS=
set hpkCAPNUMBUCKETS=
set hpkOUT_PREFIX=
For display, the graphs are shrunk vertically.
|
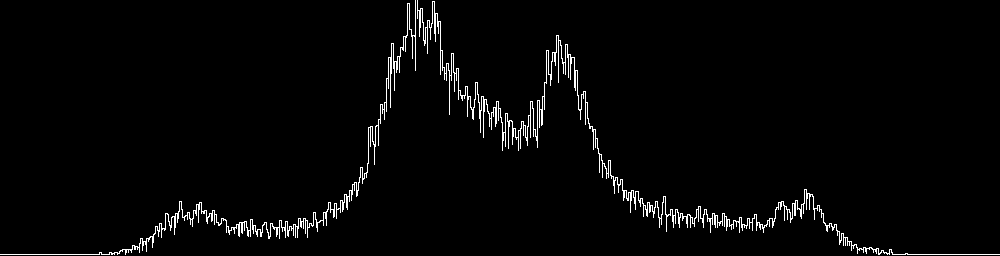
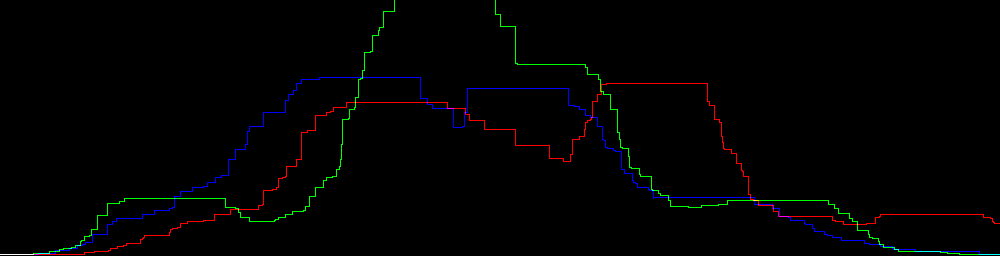
hpk_gr_h0_glc.png
The histogram of the image.
|
|
|
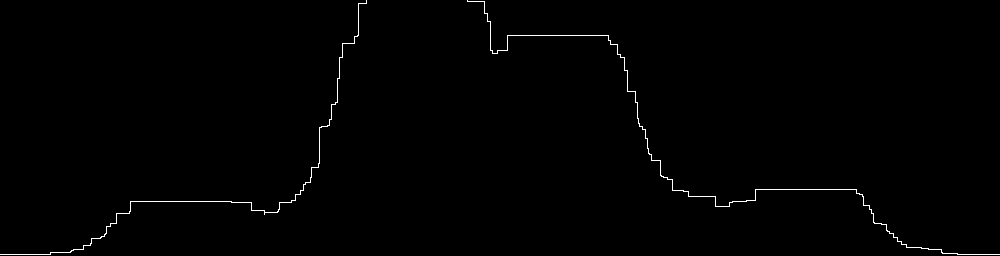
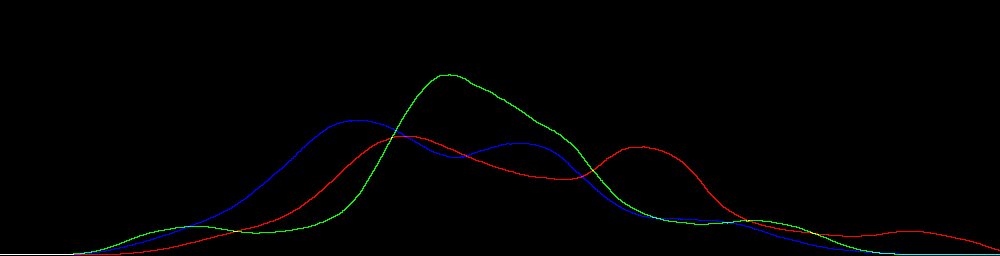
hpk_gr_hmax_glc.png
The rolling maximum of the histogram.
|
|
|
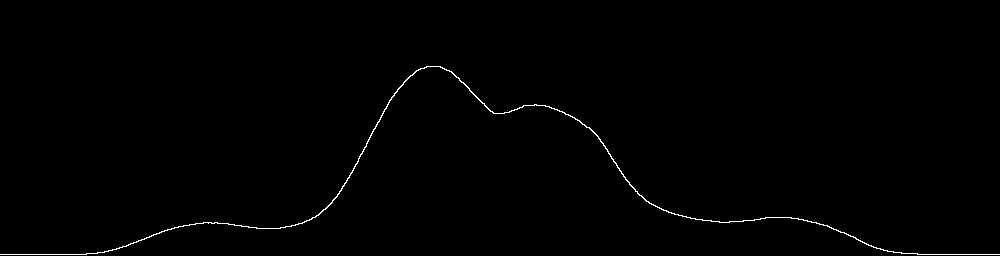
hpk_gr_hmn_glc.png
The rolling mean of the histogram.
|
|
|
hpk_gr_hm_glc.png
The maximum rolling maximum:
max (
rolling_maximum,
rolling_mean+2,
rolling_mean*1.1
) - 1
|

|
|
hpk_gr_hd_glc.png
White lines show the location of the peaks found,
before close peaks are eliminated.
|

|
|
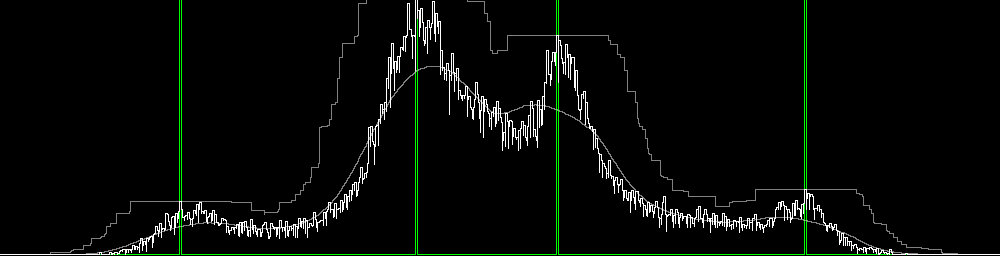
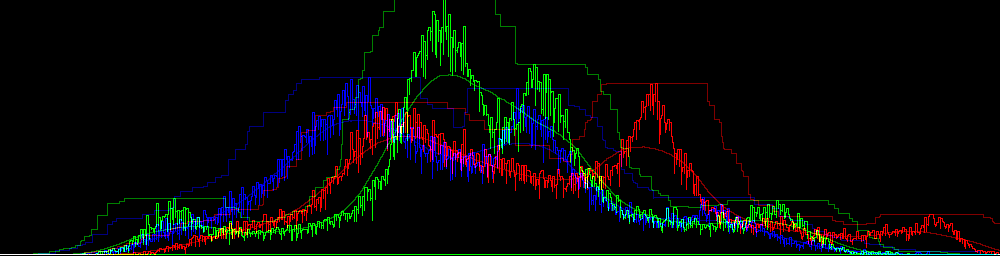
hpk_gr_h3_glc.png
Combined diagram shows the histogram, the maximum rolling maximum somewhat darkened,
and green lines for the position of the peaks.
|
|
The script makes some text files.
hpk_gr_hd.lis
allwhite:
557,0
hpk_gr_pks.lis, peaks:
Bucket,BucketPC,CountPC
557,55.75575575575576,86.2304688
hpk_gr_p2p.lis, intervals between peaks:
Bucket,Bucket_0
hpk_gr_troughs.lis, troughs:
Bucket,BucketPC,CountPC
hpk_gr_t2t.lis, intervals between troughs:
Bucket,BucketPC,CountPC,Bucket_0,BucketPC_0,CountPC_0
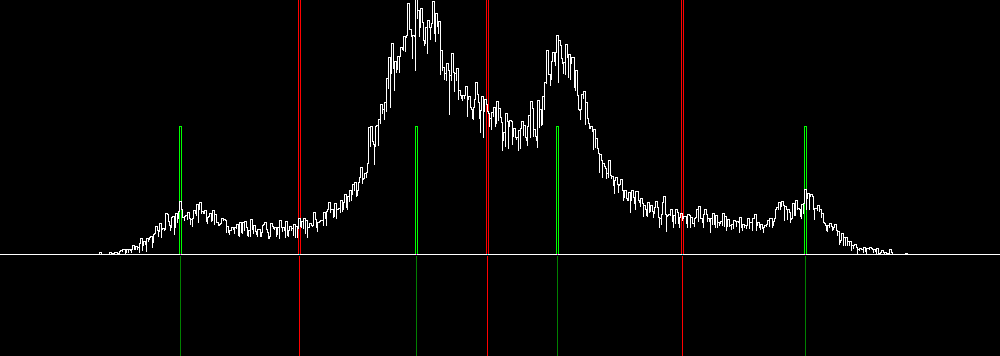
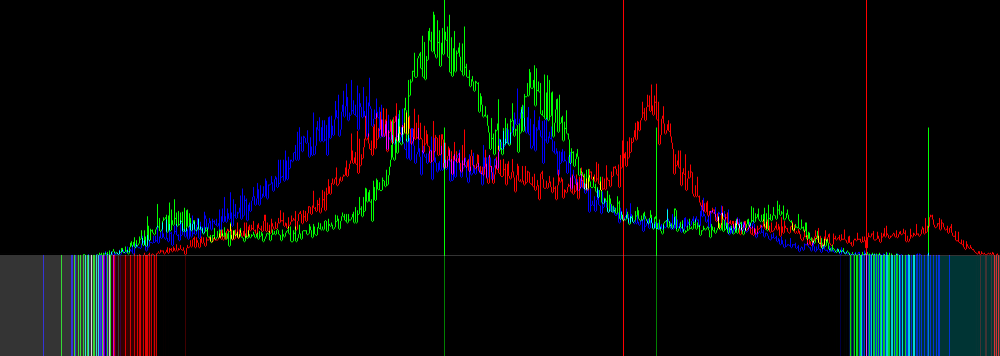
A debugging output shows the histogram in white, the position (though not the size) of the peaks in green, and the position (though not the size) of the troughs in red.
|
hpk_gr_h4_glc.png
|
|
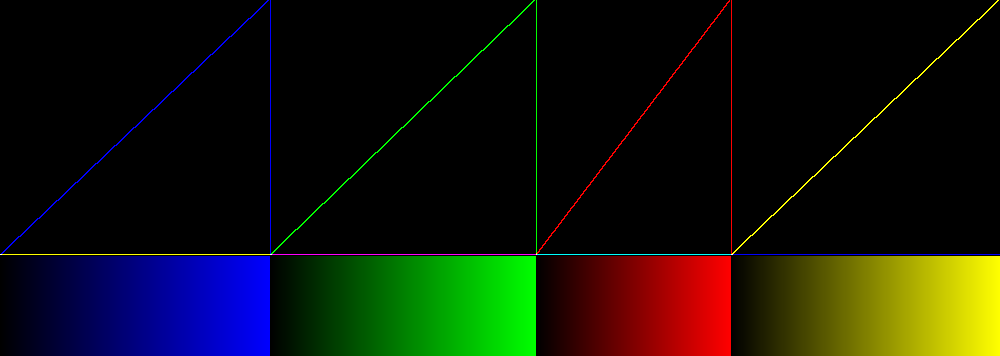
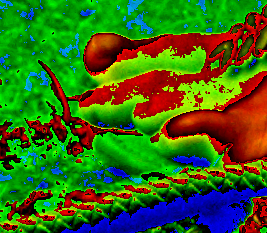
As a fairly useless application, we can show each peak in a different false colour.
We build a clut file with four segments. The first spans the histogram from zero to the first trough; the next spans from the first trough to the second, and so on. I manually calculated the width of each segment.
|
Make a clut.
rem goto :eof

%IM%convert ^
  -size 1x270 gradient:blue-black ^
  -size 1x266 gradient:lime-black ^
  -size 1x195 gradient:red-black ^
  -size 1x269 gradient:yellow-black ^
  -reverse -append +repage -rotate 90 ^
  hpk_fc_cl.png

call %PICTBAT%graphLineCol hpk_fc_cl.png
|
|
|
Apply the clut to the greyscale source.
%IM%convert ^
  %SRC_GR% ^
  hpk_fc_cl.png ^
  -clut ^
  hpk_fc_cl_gr.png
|
|
|
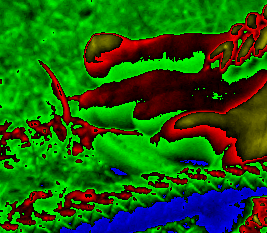
Apply the clut to the colour source.
%IM%convert ^
  %SRC_COL% ^
  hpk_fc_cl.png ^
  -clut ^
  hpk_fc_cl_col.png
|
|
As a form of contrast-limited equalisation, we can equalise each histogram segment between troughs independently from the others. As a first step towards this, we equalise a single segment.
We equalise a single peak by isolating that peak, between the adjacent troughs, by first making histogram values outside those troughs zero. We cumulate the result, then "+level" it so the values fall within the original range. We apply this as a clut to the source image.
For this example, I manually copy numbers from hpk_gr_t2t.lis above. I take each segment as starting at one trough, up to but not including the next trough.
%IMDEV%convert ^
  hpk_gr_h0.miff ^
  -fx "i<270?black:u" ^
  -fx "i>=536?black:u" ^
  +write hpk_se_1.miff ^
  -process 'cumulhisto norm' ^
  +level 27.03%%,53.65%% ^
  hpk_se_1_ch.miff

call %PICTBAT%graphLineCol hpk_se_1.miff
call %PICTBAT%graphLineCol hpk_se_1_ch.miff
|


|
%IMH%convert ^
  %SRC_GR% ^
  hpk_se_1_ch.miff ^
  -clut ^
  -define histogram:unique-colors=false ^
  +write histogram:hpk_toes_gr_x1_hist.png ^
  hpk_toes_gr_x1.png
|

|
The result has a flat (equalised) histogram between the troughs. Of course, the result looks horrible: all pixels outside the segment have become one of two shades of gray. We need to repeat the process for all four segments of the histogram.
|
Make a clut from all the segments.
%IMDEV%convert ^
  hpk_gr_h0.miff ^
  ( -clone 0 ^
    -fx "i>=270?black:u" ^
    -process 'cumulhisto norm' ^
    +level 0,27.03%% ^
  ) ^
  ( -clone 0 ^
    -fx "i<270?black:u" ^
    -fx "i>=536?black:u" ^
    -process 'cumulhisto norm' ^
    +level 27.03%%,53.65%% ^
    -fx "i<270?black:u" ^
  ) ^
  ( -clone 0 ^
    -fx "i<536?black:u" ^
    -fx "i>=731?black:u" ^
    -process 'cumulhisto norm' ^
    +level 53.65%%,73.17%% ^
    -fx "i<536?black:u" ^
  ) ^
  ( -clone 0 ^
    -fx "i<731?black:u" ^
    -process 'cumulhisto norm' ^
    +level 73.17%%,100%% ^
    -fx "i<731?black:u" ^
  ) ^
  -delete 0 ^
  -evaluate-sequence Max ^
  hpk_se_all_ch.miff

call %PICTBAT%graphLineCol ^
  hpk_se_all_ch.miff
The slope is discontinuous.
|

|
|
Apply the clut to the greyscale source.
%IMH%convert ^
  %SRC_GR% ^
  hpk_se_all_ch.miff ^
  -clut ^
  -define histogram:unique-colors=false ^
  +write ^
    histogram:hpk_toes_gr_xall_hist.png ^
  hpk_toes_gr_xall.png
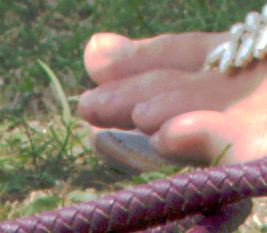
Skin tones have banded.
As expected, the histogram shows the segments have each equalised.
|


|
|
Apply the clut to the colour source.
%IMH%convert ^
  %SRC_COL% ^
  hpk_se_all_ch.miff ^
  -clut ^
  -define histogram:unique-colors=false ^
  +write ^
    histogram:hpk_toes_col_xall_hist.png ^
  hpk_toes_col_xall.png
This increases saturation and causes small shifts in hue.
Skin colours have banded.
Red channel highlights have clipped badly.
|
|
|
Apply the clut to the L (of Lab) channel of the colour source.
%IMH%convert ^
  %SRC_COL% ^
  -colorspace Lab -channel R ^
  hpk_se_all_ch.miff ^
  -clut ^
  +channel -colorspace sRGB ^
  -define histogram:unique-colors=false ^
  +write ^
    histogram:hpk_toes_col_xall_l_hist.png ^
  hpk_toes_col_xall_l.png
No shift in saturation or hue.
Banding of skin colours has softened.
Red channel highlights have clipped badly.
|
|
To prevent the process from clipping, we can make the first and last segments of the cumulative histogram a 45° slope, so these segments will not be equalised. We do this by setting that segment of the pre-cumulated histogram 100%, ie white.
(Other possibilities include interpolating between the histogram and white, or using a
Contrast-limited equalisation.)
This last result is quite good. We don't want to construct that long command by hand, so the script
equPeaks.bat does the work. If the trough-to-trough list is empty, then there is at most one trough, and we equalize across the entire range.
|
Create a clut with the script.
call %PICTBAT%equPeaks ^
  hpk_gr_h0.miff ^
  hpk_gr_t2t.lis hpk_cl0.miff

call %PICTBAT%graphLineCol hpk_cl0.miff
|

|
|
Apply the clut to the L (of Lab) channel.
%IMH%convert ^
  %SRC_COL% ^
  -colorspace Lab -channel R ^
  hpk_cl0.miff ^
  -clut ^
  +channel -colorspace sRGB ^
  -define histogram:unique-colors=false ^
  +write ^
    histogram:hpk_toes_col_xall2_l_hist.png ^
  hpk_toes_col_xall2_l.png
|

|
If we want a greyscale result, it seems better to apply the clut to a colour image then finally convert it to greyscale, rather than converting to greyscale then applying the clut.
set hpkOUT_PREFIX=hpk_col
set hpkPK_THRESHPC=0
set hpkCAPNUMBUCKETS=1000
set hpkENSURE_ENDS=
set hpkDEBUG=1

call %PICTBAT%histoPeaks %SRC_COL%

set hpkDEBUG=
set hpkENSURE_ENDS=
set hpkCAPNUMBUCKETS=
set hpkPK_THRESHPC=
set hpkOUT_PREFIX=
For display, the graphs are shrunk both vertically and horizontally.
|
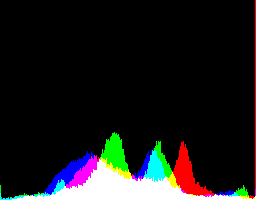
The histogram of the image.
|
|
|
The rolling maximum of the histogram.
|
|
|
The rolling mean of the histogram.
|
|
|
The maximum rolling maximum of the histogram:
max (
rolling_maximum,
rolling_mean+2,
rolling_mean*1.1
) - 1
|

|
|
White lines show the location of the peaks found,
before close peaks are eliminated.
|

|
|
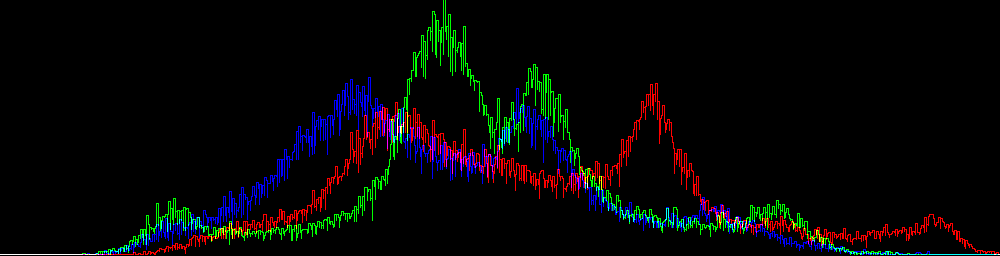
Combined diagram shows the histogram, maximum rolling maximum somewhat darkened, and green lines for the position of the peaks.
|
|
Currently, the script does not label which channel a peak came from. Processing of peaks (elimination of close peaks, finding troughs) is independent of the source of the peaks.
hpk_col_hd.lis:
allwhite:
369,0
396,0
444,0
517,0
534,0
656,0
928,0
hpk_col_p2p.lis:
Bucket,Bucket_0
444,656
656,928
hpk_col_pks.lis:
Bucket,BucketPC,CountPC
444,44.44444444444444,100
656,65.66566566566567,67.2851563
928,92.89289289289289,11.517334
hpk_col_troughs.lis:
Bucket,BucketPC,CountPC
623,62.36236236236236,38.1835938
866,86.68668668668669,3.03039551
hpk_col_t2t.lis:
Bucket,BucketPC,CountPC,Bucket_0,BucketPC_0,CountPC_0
623,62.36236236236236,38.1835938,866,86.68668668668669,3.03039551
A debugging output shows the histogram in white, the position (though not the size) of the peaks in green, and the position (though not the size) of the troughs in red.
|
hpk_col_h4_glc.png
|
|
Blah.
del hpk_*.BAK
rem del hpk_*.miff
For convenience, .bat scripts are also available in a single zip file. See
Zipped BAT files.
The script uses -intensity Brightness -format "... %%[fx:p{n,0}.intensity]" to get the maximum of the R,G,B values at the specified pixel. Current IM (v6.9.0-0) ignores this intensity setting. This is a bug that should be fixed by the time you read this. See forum thread
p{}.intensity ignores -intensity. I have modified my %IMDEV% version as shown in that thread.
An alternative is to make a -grayscale Brightness version of %hpkOUT_PREFIX%_h0.miff, and read that image instead.
For the CSV processing, the script calls utility programs such as cPrefix, cSelect, cNextRow, cHead, cSort and cExtend. I do not provide the source or binaries of these.
rem From image %1,
rem finds histogram peaks (and troughs).
@rem
@rem   hpkOUT_PREFIX. Default "hpk".
@rem   hpkDEBUG if 1, creates debugging files
@rem   hpkCAPNUMBUCKETS
@rem   hpkENSURE_ENDS if 1, also process end segments
@rem   hpkHIST_BLR string for blurring the histogram, eg -blur 0x2
@rem   hpkWIN_PROP window width as proportion of histogram width. Default 0.1
@rem   hpkPK_THRESHPC peaks less than this threshold (percent) are ignored. Default 0.
@rem   [hpkTR_THRESHPC troughs more than this threshold (percent) are ignored. Default 100.]
@rem   hpkLIMIT_NUM_PKS if not zero, limits the number of peaks.


@if "%1"=="" findstr /B "rem @rem" %~f0 & exit /B 1

@setlocal enabledelayedexpansion

rem @call echoOffSave

call %PICTBAT%setInOut %1 hpk

if not "%2"=="" set OUTFILE=%2

if "%hpkOUT_PREFIX%"=="" set hpkOUT_PREFIX=%sioCODE%

if "%HPK_THRESH%"=="" set HPK_THRESH=0.1

if "%hpkWIN_PROP%"=="" set hpkWIN_PROP=0.1

if "%hpkPK_THRESHPC%"=="" set hpkPK_THRESHPC=0

if "%hpkLIMIT_NUM_PKS%"=="" set hpkLIMIT_NUM_PKS=0


call StopWatch

set /A NUM_BUCK=4000
set /A NUM_BUCKm1=%NUM_BUCK%-1

if "%hpkCAPNUMBUCKETS%"=="" (
  set CAP_BUCK=
) else (
  set CAP_BUCK=capnumbuckets %hpkCAPNUMBUCKETS%
)

for /F "usebackq" %%L in (`%IM%identify ^
  -format "WIN_WIDTH=%%[fx:%NUM_BUCK%*%hpkWIN_PROP%]" ^
  xc:`) do set %%L

if "%hpkDEBUG%"=="1" (
  set WR_hmax=+write %hpkOUT_PREFIX%_hmax.miff
  set WR_hmn=+write %hpkOUT_PREFIX%_hmn.miff
  set WR_hm=+write %hpkOUT_PREFIX%_hm.miff
  set WR_hd=+write %hpkOUT_PREFIX%_hd.miff
) else (
  set WR_hmax=
  set WR_hmn=
  set WR_hm=
  set WR_hd=
)

%IMDEV%convert ^
  %INFILE% ^
  -process 'mkhisto %CAP_BUCK% norm' ^
  %hpkOUT_PREFIX%_h0.miff

for /F "usebackq" %%L in (`%IM%identify ^
  -ping ^
  -format "NUM_BUCK=%%[fx:w]\nNUM_BUCKm1=%%[fx:w-1]\nWIN_WIDTH=%%[fx:int(w*%hpkWIN_PROP%+0.5)]" ^
  %hpkOUT_PREFIX%_h0.miff`) do set %%L


set DECLIP_LO=-fill #000 -draw "point 0,0"
set DECLIP_HI=-fill #000 -draw "point %NUM_BUCKm1%,0"

:: temp: save as integer and read that, to convert to integer,
:: to avoid bug where "-statistic" is wrong for non-integers.
:: Bother, no, that doesn't help.

%IMDEV%convert ^
  %hpkOUT_PREFIX%_h0.miff ^
  -define quantum:format=floating-point ^
  -depth 32 ^
  %DECLIP_LO% ^
  %DECLIP_HI% ^
  %hpkHIST_BLR% ^
  -auto-level ^
  +write %hpkOUT_PREFIX%_h0.miff ^
  -define quantum:format=integer ^
  +write %hpkOUT_PREFIX%_h0.tiff ^
  -define quantum:format=floating-point ^
  +delete ^
  %hpkOUT_PREFIX%_h0.tiff ^
  ( -clone 0 ^
    ( -clone 0 -statistic maximum %WIN_WIDTH%x1 %WR_hmax% ) ^
    ( -clone 0 -statistic mean %WIN_WIDTH%x1 %WR_hmn% ) ^
    ( -clone 2 -evaluate Add 2 ) ^
    ( -clone 2 -evaluate Multiply 1.1 ) ^
    -delete 2 ^
    -delete 0 ^
    -evaluate-sequence Max ^
    -evaluate Subtract 1 ^
    %WR_hm% ^
  ) ^
  -compose MinusSrc -composite ^
  -clamp ^
  -fill #fff +opaque #000 ^
  -process allwhite ^
  %WR_hd% ^
  NULL: 2>%hpkOUT_PREFIX%_hd.lis

rem After -compose MinusSrc -composite, values are 1, 0 or <0.

rem This gives us the X-coord of the peaks.
rem We can retrieve the histogram values at these locations,
rem and eliminate "small" peaks.
rem
rem Then we can loop through the gaps,
rem and process that portion of the histogram to find the lowest points,
rem which are the troughs.

rem We have segments, that can be numbered with "-connected-components".

call StopWatch

if "%hpkDEBUG%"=="1" (
  call %PICTBAT%graphLineCol %hpkOUT_PREFIX%_h0.miff . . 0 %hpkOUT_PREFIX%_h0_glc.png
  call %PICTBAT%graphLineCol %hpkOUT_PREFIX%_hd.miff . . 0 %hpkOUT_PREFIX%_hd_glc.png
  call %PICTBAT%graphLineCol %hpkOUT_PREFIX%_hm.miff . . 0 %hpkOUT_PREFIX%_hm_glc.png
  call %PICTBAT%graphLineCol %hpkOUT_PREFIX%_hmn.miff . . 0 %hpkOUT_PREFIX%_hmn_glc.png
  call %PICTBAT%graphLineCol %hpkOUT_PREFIX%_hmax.miff . . 0 %hpkOUT_PREFIX%_hmax_glc.png

  %IM%convert ^
    %hpkOUT_PREFIX%_h0_glc.png ^
    %hpkOUT_PREFIX%_hd_glc.png ^
    %hpkOUT_PREFIX%_hm_glc.png ^
    %hpkOUT_PREFIX%_hmn_glc.png ^
    -evaluate-sequence Max ^
    %hpkOUT_PREFIX%_h3_glc.png

  %IM%convert ^
    ^( %hpkOUT_PREFIX%_h0_glc.png ^) ^
    ^( %hpkOUT_PREFIX%_hd_glc.png +level-colors black,lime ^) ^
    ^( %hpkOUT_PREFIX%_hm_glc.png -evaluate Multiply 0.5 ^) ^
    ^( %hpkOUT_PREFIX%_hmn_glc.png -evaluate Multiply 0.5 ^) ^
    -channel RGB -evaluate-sequence Max +channel ^
    %hpkOUT_PREFIX%_h3_glc.png
)

%IM%convert %hpkOUT_PREFIX%_hd.miff +transparent #fff sparse-color:

rem type %hpkOUT_PREFIX%_hd.lis


rem Write a list of peaks, optionally adding the two ends.

set PKS_F=%hpkOUT_PREFIX%_pks.lis
del %PKS_F% 2>nul

for /F "skip=1 tokens=1 delims=, " %%x in (%hpkOUT_PREFIX%_hd.lis) do (
  for /F "usebackq" %%C in (`%IMDEV%convert ^
    %hpkOUT_PREFIX%_h0.miff ^
    -precision 9 ^
    -intensity Brightness ^
    -format "COUNT_PC=%%[fx:100*p{%%x,0}.intensity]" ^
    info:`) do set %%C

    echo %%x,!COUNT_PC! >>%PKS_F%
)

if "%hpkENSURE_ENDS%"=="1" (
  for /F "usebackq" %%C in (`%IMDEV%convert ^
    %hpkOUT_PREFIX%_h0.miff ^
    -precision 9 ^
    -intensity Brightness ^
    -format "COUNT_PC=%%[fx:100*p{0,0}.intensity]" ^
    info:`) do set %%C

  echo 0,!COUNT_PC! >>%PKS_F%

  for /F "usebackq" %%C in (`%IMDEV%convert ^
    %hpkOUT_PREFIX%_h0.miff ^
    -precision 9 ^
    -intensity Brightness ^
    -format "COUNT_PC=%%[fx:100*p{%NUM_BUCKm1%,0}.intensity]" ^
    info:`) do set %%C

  echo %NUM_BUCKm1%,!COUNT_PC! >>%PKS_F%

  rem We might already have ends, so sort, removing duplicates.
  cSort /p0 /i%PKS_F% /o%PKS_F% /k0 /u
)

cPrefix  /p0 /i%PKS_F% /tBucket,CountPC


rem Remove low COUNT_PC.

cSelect  /p0 /i%PKS_F% /h /kCountPC /q6 /w%hpkPK_THRESHPC%


rem Build a peak-to-peak list, to identify and remove peaks that make small gaps.
rem
rem We find the smallest gap.
rem If it is less than WIN_WIDTH, we remove one peak from PKS_F and iterate.

set P2P_F=%hpkOUT_PREFIX%_p2p.lis

:loopGap
cNextRow /p0 /i%PKS_F% /o%P2P_F% /f"," /k0-1 /h
cHead    /p0 /i%P2P_F% /t1 /x
cExtend  /p0 /i%P2P_F% /kGap /v=Bucket_0-Bucket=
cSort    /p0 /i%P2P_F% /h /kGap
cHead    /p0 /i%P2P_F% /h2
cExtend  /p0 /i%P2P_F% /kSmaller /v=iif(CountPC^<CountPC_0,Bucket,Bucket_0)=

rem type %P2P_F%

set DONE_ONE=0
for /F "skip=1 tokens=1-6 delims=, " %%A in (%P2P_F%) do (
  if %%E LEQ %WIN_WIDTH% (
    cSelect /p0 /i%PKS_F% /h /kBucket /w%%F /x
    set DONE_ONE=1
  )
)

if %DONE_ONE%==1 goto loopGap


rem Limit the number of peaks.

if "%hpkLIMIT_NUM_PKS%" GTR "0" (
  set /A LIM=%hpkLIMIT_NUM_PKS%+1
  cSort /i%PKS_F% /h /kCountPC /r /o- | cHead /p0 /i- /o- /h%LIM% | cSort /i- /o%PKS_F% /h /kBucket
)


rem Re-build the peak-to-peak list.

cProject /p0 /i%PKS_F% /o%P2P_F% /h /kBucket
cNextRow /p0 /i%P2P_F% /f"," /k0 /h
cHead    /p0 /i%P2P_F% /t1 /x


rem Find the troughs.

set TS_F=%hpkOUT_PREFIX%_troughs.lis
echo Bucket,CountPC >%TS_F%

for /F "skip=1 tokens=1-2 delims=, " %%A in (%P2P_F%) do (
  set /A WW=%%B-%%A+1

  set /A WW_2=WW/2
  set /A WW_2+=WW-2*WW_2

  for /F "usebackq tokens=1-2 delims=:, " %%C in (`%IMDEV%convert ^
    %hpkOUT_PREFIX%_h0.miff ^
    -crop !WW!x1+%%A+0 +repage ^
    -crop 2x1@ +repage ^
    ^( -clone 0 -rotate -90 ^) ^
    ^( -clone 1 -rotate 90 ^) ^
    -delete 0-1 ^
    -negate ^
    -background #000 ^
    +append +repage ^
    -process onelightest ^
    NULL: 2^>^&1`) do (

    if %%C==0 (
      set /A WX=%%A+!WW_2!-%%D-1
    ) else (
      set /A WX=%%A+!WW_2!+%%D
    )
  )

  for /F "usebackq" %%C in (`%IMDEV%convert ^
    %hpkOUT_PREFIX%_h0.miff ^
    -precision 9 ^
    -intensity Brightness ^
    -format "COUNT_PC=%%[fx:100*p{!WX!,0}.intensity]" ^
    info:`) do set %%C

  echo WW=!WW! WW_2=!WW_2! WX=!WX!
  echo !WX!,!COUNT_PC! >>%TS_F%
)

rem Add "BucketPC" columns, as percentages.
cExtend  /i%TS_F% /kBucketPC /v=100*Bucket/%NUM_BUCKm1%=
cProject /i%TS_F% /h /s /kBucket,BucketPC,CountPC
cExtend  /i%PKS_F% /kBucketPC /v=100*Bucket/%NUM_BUCKm1%=
cProject /i%PKS_F% /s /h /kBucket,BucketPC,CountPC

set T2T_F=%hpkOUT_PREFIX%_t2t.lis
cNextRow /p0 /i%TS_F% /o%T2T_F% /f"," /k0-2 /h
cHead    /p0 /i%T2T_F% /t1 /x


if "%hpkDEBUG%"=="1" (
  set DRAW_PKS_F=%TEMP%\dpks.lis
  set DRAW_TS_F=%TEMP%\dts.lis

  cProject /p0 /i%PKS_F% /o!DRAW_PKS_F! /h /kBucket
  cHead    /p0 /i!DRAW_PKS_F! /h1 /x
  cPrefix  /p0 /i!DRAW_PKS_F! /l"point " /r",0"

  cProject /p0 /i%TS_F% /o!DRAW_TS_F! /h /kBucket
  cHead    /p0 /i!DRAW_TS_F! /h1 /x
  cPrefix  /p0 /i!DRAW_TS_F! /l"point " /r",0"

  %IM%convert ^
    -size %NUM_BUCK%x1 ^
    xc:#000 ^
    -fill Green -draw @!DRAW_PKS_F! ^
    -fill Red -draw @!DRAW_TS_F! ^
    %hpkOUT_PREFIX%_pktr.png

  call %PICTBAT%graphLineCol %hpkOUT_PREFIX%_pktr.png

  %IM%convert ^
    %hpkOUT_PREFIX%_h0_glc.png ^
    %hpkOUT_PREFIX%_pktr_glc.png ^
    -evaluate-sequence Max ^
    %hpkOUT_PREFIX%_h4_glc.png
)


call StopWatch


call echoRestore

@endlocal & set hpkOUTFILE=%OUTFILE%
rem Given
rem   %1 is the histogram of an image eg hpk_gr_h0.miff,
rem   %2 is CSV list of peaks in %1, from histoPeaks.bat,
rem     eg hpk_gr_t2t.lis
rem writes a clut image to equalise each peak.
rem Optional %3 is output filename.


@if "%2"=="" findstr /B "rem @rem" %~f0 & exit /B 1

@setlocal enabledelayedexpansion

rem @call echoOffSave

call %PICTBAT%setInOut %1 eqpk

set IN_HIST=%1
set IN_T2T=%2

if not "%3"=="" set OUTFILE=%3

set TMP_BAT=%TEMP%\%sioCODE%_tmp.bat


echo %IMDEV%convert %IN_HIST% >%TMP_BAT%

set DONE_FIRST=0

set SET_WHITE=-fill White -colorize 100

for /F "skip=1 tokens=1,2,4,5 delims=, " %%A in (%IN_T2T%) do (
  echo %%A,%%B,%%C,%%D

  if !DONE_FIRST!==0 (
    echo ^( -clone 0 >>%TMP_BAT%
    echo   %SET_WHITE% >>%TMP_BAT%
    echo   -fx "i>=%%A?black:u" >>%TMP_BAT%
    echo   -process 'cumulhisto norm' >>%TMP_BAT%
    echo   +level 0,%%B%%%% ^) >>%TMP_BAT%

    set DONE_FIRST=1
  )

  echo ^( -clone 0 >>%TMP_BAT%
  echo   -fx "i<%%A?black:u" >>%TMP_BAT%
  echo   -fx "i>=%%C?black:u" >>%TMP_BAT%
  echo   -process 'cumulhisto norm' >>%TMP_BAT%
  echo   +level %%B%%%%,%%D%%%% >>%TMP_BAT%
  echo   -fx "i<%%A?black:u" ^) >>%TMP_BAT%

  set BUCK_NUM=%%C
  set THR=%%D
)

rem And last (or only) segment
if !DONE_FIRST!==1 (
  echo ^( -clone 0 >>%TMP_BAT%
  echo   %SET_WHITE% >>%TMP_BAT%
  echo   -fx "i<%BUCK_NUM%?black:u" >>%TMP_BAT%
  echo   -process 'cumulhisto norm' >>%TMP_BAT%
  echo   +level %THR%%%%%,100%%%% >>%TMP_BAT%
  echo   -fx "i<%BUCK_NUM%?black:u" ^) >>%TMP_BAT%
) else (
  echo ^( -clone 0 >>%TMP_BAT%
  echo   -process 'cumulhisto norm' ^) >>%TMP_BAT%
)

echo -delete 0 >>%TMP_BAT%
echo -evaluate-sequence Max >>%TMP_BAT%
cPrefix /i%TMP_BAT% /r"^"
echo %OUTFILE% >>%TMP_BAT%

type %TMP_BAT%

call %TMP_BAT%

call %PICTBAT%graphLineCol %OUTFILE%


call echoRestore

@endlocal & set eqpkOUTFILE=%OUTFILE%
All images on this page were created by the commands shown.
To improve internet download speeds, some images may have been automatically converted (by ImageMagick, of course) from PNG to JPG.
My usual version of IM is:
%IM%identify -version
Version: ImageMagick 6.9.9-50 Q16 x64 2018-06-02 http://www.imagemagick.org
Copyright: Copyright (C) 1999-2015 ImageMagick Studio LLC
License: http://www.imagemagick.org/script/license.php
Visual C++: 180040629
Features: Cipher DPC Modules OpenMP
Delegates (built-in): bzlib cairo flif freetype gslib heic jng jp2 jpeg lcms lqr lzma openexr pangocairo png ps raw rsvg tiff webp xml zlib
This customised development version is:
%IMDEV%identify -version
Version: ImageMagick 6.9.9-40 Q32 x86_64 2018-11-30 http://www.imagemagick.org
Copyright: © 1999-2018 ImageMagick Studio LLC
License: http://www.imagemagick.org/script/license.php
Features: Cipher DPC HDRI Modules OpenMP
Delegates (built-in): bzlib cairo fftw fontconfig fpx freetype jbig jng jpeg lcms ltdl lzma pangocairo png rsvg tiff webp wmf x xml zlib
Source file for this web page is histopeaks.h1. To re-create this web page, run "procH1 histopeaks".
This page, including the images, is my copyright. Anyone is permitted to use or adapt any of the code, scripts or images for any purpose, including commercial use.
Anyone is permitted to re-publish this page, but only for non-commercial use.
Anyone is permitted to link to this page, including for commercial use.
Page version v1.0 5-January-2015.
Page created 01-Dec-2018 17:51:24.
Copyright © 2018 Alan Gibson.